The Efficiency Equation: Linking Education Investment to Innovation Success
Explore how education investment efficiency — not just spending volume — shapes global innovation leadership. Uncover which countries are getting it right, and what it means for sustainable competitive advantage.
4/27/20252 min read
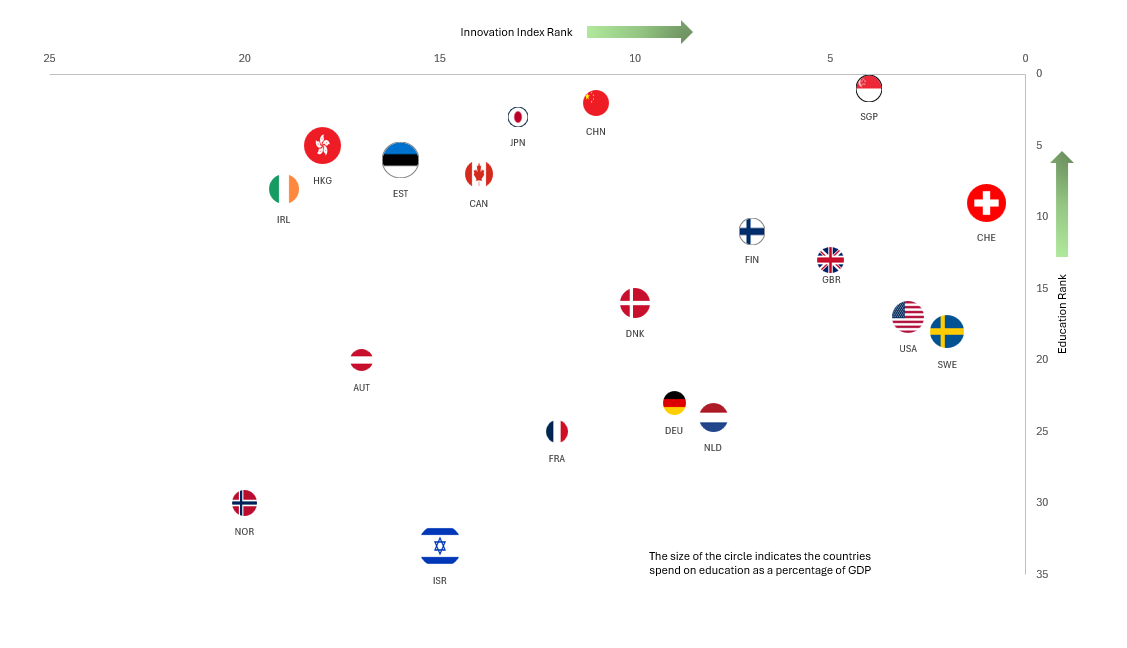
This graph synthesizes education attainment (PISA rank), innovation strength (Global Innovation Index rank), and education investment (spend as a percentage of GDP, reflected in circle size) across leading economies.
This visualization offers a multidimensional snapshot of how countries perform at the intersection of innovation (GII rank), educational strength (PISA-based rank), and investment in education (as % of GDP, indicated by circle size). Countries that cluster near the top right (e.g., Singapore, Switzerland, Sweden, USA) represent high performers across all three axes—global innovation leaders with strong educational systems and relatively high spending on education.
Singapore stands out most dramatically. With a near-ideal combination of #1 in GII and #1 in education ranking, it also maintains a healthy education investment footprint, suggesting a tight coupling between educational quality and innovation output. Switzerland, also in the upper echelon of both rankings, displays the largest investment in education (as indicated by circle size), underscoring a systemic, high-capacity approach to translating educational input into innovation outcomes.
Sweden and the USA follow closely, showcasing solid positions in both innovation and education, but slightly trailing Singapore in educational rank. Notably, the USA spends significantly on education but achieves only moderate returns in education rank relative to its innovation leadership—suggesting possible inefficiencies or systemic disparities in educational equity or output.
Hong Kong, Japan, Estonia, and Finland form a striking band of countries that, despite relatively smaller economies, punch above their weight in both education and innovation. Hong Kong, in particular, combines low GDP spending with elite educational performance, indicating a highly efficient system.
In contrast, France, Austria, Norway, and Israel exhibit middling to low educational performance despite mid-tier innovation ranks and high spending levels. Their relatively large circle sizes (education spend) juxtaposed with low educational rank suggest less efficient conversions of investment into outcomes.
Several countries appear as outliers:
Ireland and Hong Kong have strong education ranks and respectable innovation rankings, yet their smaller circles suggest they achieve this with moderate investment.
China excels in innovation (ranked 12th in GII) but has a significantly lower education rank. This discrepancy suggests an innovation model more reliant on scale, industrial complexity, or applied R&D rather than widespread educational excellence.
Israel, despite being a notable innovation performer (rank 15 in GII), lags significantly in education rank and spends heavily—hinting at a skewed emphasis toward higher education or R&D rather than foundational educational systems.
So what does this mean?:
Education investment alone does not guarantee innovation leadership.
High educational outcomes, especially those reflected in PISA scores, are strongly correlated with better innovation performance when aligned with systemic investment (e.g., Singapore, Finland).
The size-adjusted positioning of countries in this graph could help policymakers benchmark systemic efficiency—i.e., how well spending translates into quality education and then into innovation capacity.
Citation and References
Education index - PISA Scores by Country 2025. World Population Review. Retrieved April 26, 2025, from https://worldpopulationreview.com/country-rankings/pisa-scores-by-country#title
Innovation index from -World Intellectual Property Organization (WIPO) (2024). Global Innovation Index 2024: Unlocking the Promise of Social Entrepreneurship. Geneva: WIPO. 10.34667/tind.50062
Public Domain, https://en.wikipedia.org/w/index.php?curid=33285428
Education as a percentage of GDP - https://data.worldbank.org/indicator/SE.XPD.TOTL.GB.ZS