Obesity Prevalence vs. Food Sales Per Capita by State
Exploring the correlation between Food Spending and Obesity at a state level
5/8/20241 min read
Food Spending and Obesity: What the Data Tells Us
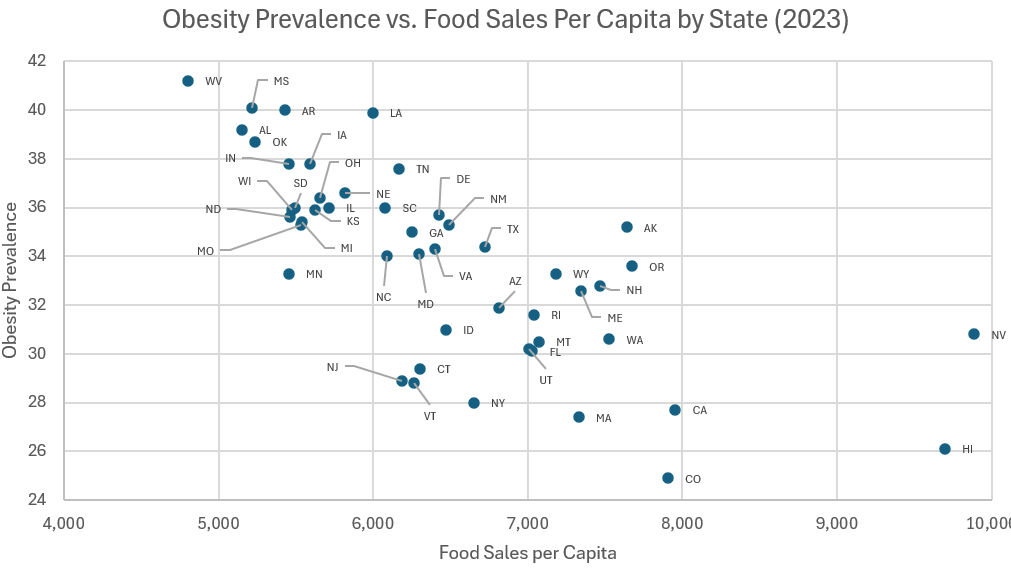
We bring together two data sets from 2023—one from the U.S. Department of Agriculture's Food Expenditure Series, which shows state-level food spending, and another from the CDC, detailing obesity prevalence by state.
The USDA data is divided into two primary categories:
FAH (Food at Home): Grocery and packaged food purchases for home consumption.
FAFH (Food Away From Home): Prepared meals and snacks intended for immediate consumption, such as those from restaurants or takeout.
The CDC data provides obesity prevalence at the state level.
An analysis of these combined data sets reveals a strong negative correlation between total per capita food spending and obesity prevalence. In simple terms, states that spend more on food tend to report lower obesity rates. Specifically, the correlation coefficient is -0.71, indicating a consistent and significant inverse relationship.
This suggests that higher food spending may reflect:
Better access to quality nutrition
Healthier food choices
Socio-economic conditions that support healthier lifestyles
Of course, correlation does not imply causation, and further, more detailed analysis would be needed to understand the underlying factors driving this trend.
Conclusion
As we continue to explore the relationship between economics, access, and public health, this data adds an important perspective: investments in food—whether at home or away—can be an indicator of broader well-being. The patterns we're seeing invite a deeper look at how food systems, affordability, and education shape outcomes at the state level.
Citation
Centers for Disease Control and Prevention. Adult Obesity Prevalence Maps. U.S. Dept of Health and Human Services; 2023.
U.S. Department of Agriculture, Economic Research Service. Food expenditure series.